This site uses cookies to improve your experience. To help us insure we adhere to various privacy regulations, please select your country/region of residence. If you do not select a country, we will assume you are from the United States. Select your Cookie Settings or view our Privacy Policy and Terms of Use.
Cookie Settings
Cookies and similar technologies are used on this website for proper function of the website, for tracking performance analytics and for marketing purposes. We and some of our third-party providers may use cookie data for various purposes. Please review the cookie settings below and choose your preference.
Used for the proper function of the website
Used for monitoring website traffic and interactions
Cookie Settings
Cookies and similar technologies are used on this website for proper function of the website, for tracking performance analytics and for marketing purposes. We and some of our third-party providers may use cookie data for various purposes. Please review the cookie settings below and choose your preference.
Strictly Necessary: Used for the proper function of the website
Performance/Analytics: Used for monitoring website traffic and interactions
Crashes that expose debug logs or emails = instant fail. Impact : Last-minute code rewrites, additional QA cycles, and missed release windows. Hold Weekly QA-Dev-Pub Syncs Especially near code freeze, make sure everyone stays aligned on blockers and timelines. And make your first-party partners proud.
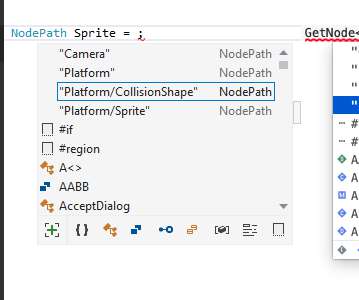
For those that don’t speak.NET lingo, “NativeAOT” refers to the ability for.NET applications to compile directly to a device’s native code, bypassing the need for the.NET runtime entirely. GH-74393 ) Code completion for overridden user-defined methods. ( And more: TextEdit/LineEdit: Add support for OEM Alt codes input. (
Visual Studio Code - IDE Visual Studio Code (VS Code) is a lightweight, free, open-source code editor redefined and optimized for building and debugging modern web and cloud applications.
Weve unified the code to make sure it works the same on both platforms, and weve fixed some bugs. To further improve your debugging experience Hendrik introduced a checkbox that allows you to start the profiler automatically when you run your game from the editor and capture valuable profiling data immediately ( GH-96759 ).
JetBrains Rider is a must-have IDE and code editor for GDScript, C#, and C++, with specific support for various different game engines, including Godot. and specific inspections and quick fixes to help with best practices while writing, debugging or testing code for your game. Check out their page for more details.
release, we made it a priority to finalize, and thus we now merged this major feature with over 32,000 lines of code, after hundreds of comments with feedback/testing. Stack traces are now available in projects exported in release mode as well if the Debug > Settings > GDScript > Always Track Call Stacks project setting is enabled.
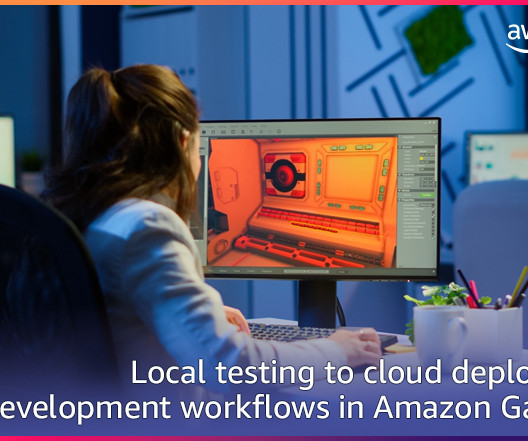
Once youre ready to transition to Amazon GameLift managed fleets, create an Amazon GameLift managed fleet, then change the game server InitSDK() code call to remove Amazon GameLift Anywhere fleet parameters. The follow Amazon GameLift C++ SDK integration code snippet uses example values for Amazon GameLift Anywhere serverParameters.
AWS was able to meet that need by partnering with AWS Partner Code Wizards Group and leveraging the Amazon GameLift Migration Support Program to deliver a thorough, phased, low-risk migration planresulting in one of the largest AWS-led infrastructure transitions ever completed for a live service game.
The application works both with managed.NET code and unmanaged code like C++. In the standalone version you can start a debugging command by selecting the executable you want to run and the working directory and any arguments you want to pass in. It can detect leaks with various Windows objects and handles.
This can be accomplished with the following AWS Command Line Interface ( AWS CLI ) code. #!/bin/bash The runtime configuration provided in the prior code block sets us up with 12 game server processes for the game on each VM, each with different parameters (notably the port). Next, scale up the Fleet to prepare for the games launch.
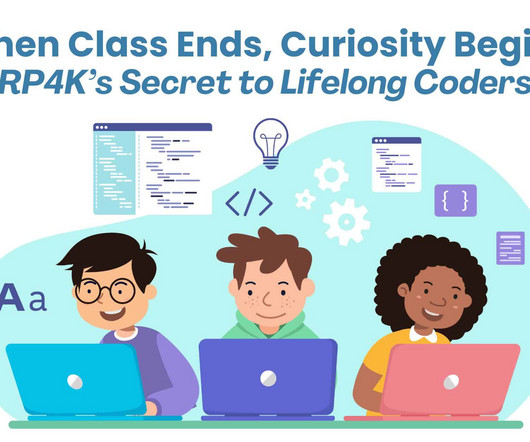
Your child just finished their coding class, and suddenly, theyre speaking a new language. At Real Programming 4 Kids (RP4K), coding doesnt stop when class ends. Our project-based approach helps students connect coding with creativity, logic with action, and math with meaning. Collision detection. Time gets tight.
This will be about how when in your C++ code you have a “vector math library”, and how the choices of code style in there affect non-optimized build performance. Backstory A month ago I got into the rabbit hole of trying to “sanitize” the various ways that images can be resized within Blender codebase.
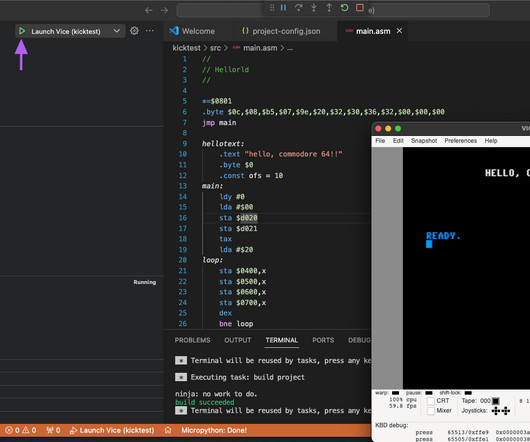
You can code for the C64, for free, using Microsoft Visual Studio Code! The Commodore 64 Programming Extension – VS64 VS64 is a Visual Studio Code extension for C64 programmers by Rolandshacks on Github. but the best way to install it is through Visual Studio Code itself. At the time of writing it is on version 2.5.3
Static analysis is a debugging method, typically used early in development. Find out how it differs from dynamic analysis, benefits and limitations of static analysis — and when you should use it.
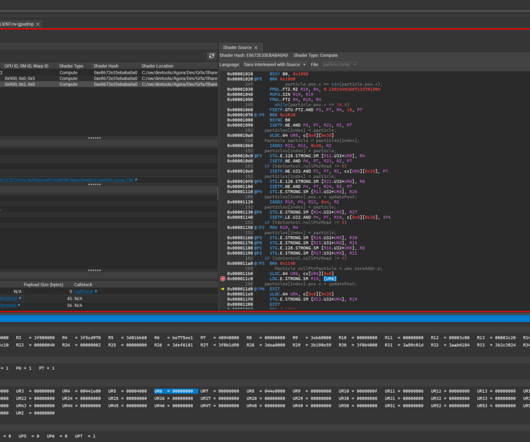
To manage this level of complexity, it becomes necessary to observe a decomposition of shader performance at the HLSL or GLSL source-code level. As ray tracing becomes the predominant rendering technique in modern game engines, a single GPU RayGen shader can now perform most of the light simulation of a frame.
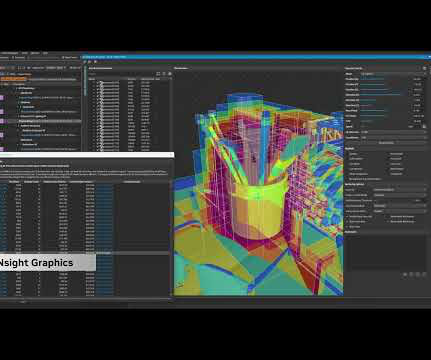
NVIDIA Nsight Developer Tools provide comprehensive access to NVIDIA GPUs and graphics APIs for performance analysis, optimization, and debugging activities. NVIDIA Nsight Developer Tools provide comprehensive access to NVIDIA GPUs and graphics APIs for performance analysis, optimization, and debugging activities.
Try to get hold of “Sonar Systems” he the one that know most about installations and would know best for compiler setups I only worked with android studio and debug its perfect. not shore if you call MessageBox(“Hello world”, “Debug Dialog”); would give you output in windows app to get you going and get some sort of output.
and I need to show 3d physic debug I have a simple capsule which is attached with a cc.BoxCollider In code I have this settings PhysicsSystem.instance.enable = true; PhysicsSystem.instance.debugDrawFlags = EPhysicsDrawFlags.WIRE_FRAME; But when preview with browser I see nothing like a debug line. Hi, I’m using Creator 3.8.2
and I need to show 3d physic debug I have a simple capsule which is attached with a cc.BoxCollider In code I have this settings PhysicsSystem.instance.enable = true; PhysicsSystem.instance.debugDrawFlags = EPhysicsDrawFlags.WIRE_FRAME; But when preview with browser I see nothing like a debug line. Hi, I’m using Creator 3.8.2
and I need to show 3d physic debug I have a simple capsule which is attached with a cc.BoxCollider In code I have this settings PhysicsSystem.instance.enable = true; PhysicsSystem.instance.debugDrawFlags = EPhysicsDrawFlags.WIRE_FRAME; But when preview with browser I see nothing like a debug line. Hi, I’m using Creator 3.8.2
The few custom tools I use (Wimpy, for example) and all built from the same code the engine is, so once it's working under Linux, they should compile as well. Writing C/C++ code in a nice text editor and compiling it isn't really the issue. The real issue is going to be developing the "engine", which I spend most of my day doing.
There is always some layer of abstraction between the physical computer and the application that you are building, but you can’t optimize and debug what you can’t see. When you’re coding, an error is returned when a line doesn’t work. Nsight Graphics offers in-depth graphics debugging for both ray-traced and rasterized applications.
The intersection of artificial intelligence (AI) and coding is sparking a new era of possibilities in the tech world. AI advancements are improving how we code, shaping the future of software development, and empowering the next generation of developers.
The few custom tools I use (Wimpy, for example) and all built from the same code the engine is, so once it’s working under Linux, they should compile as well. Writing C/C++ code in a nice text editor and compiling it isn’t really the issue. It seems that Linux IDEs are really behind in this.
On the build config, you will find an option “Debug”. Check it and build again it should appear docs.cocos.com Publish to Web Platforms | Cocos Creator Cocos Creator Docs
Hello, I am trying to use VS Code for my cocos2d-x c++ development but am not able to find any documentation for this. Can anyone point me in the right direction. Thank you.
It has beefier hardware than the retail console (because it needs to be able to hold and run debug builds of the game). Game consoles today typically have plugins for Microsoft Visual studio to handle the remote debugging process. Those text interfaces exist so we can access debug commands.
rybones: On the build config, you will find an option “Debug”. Check it and build again it should appear I know about this. But this information is always shown. And it is not always clearly visible (size, color). I want to be able to display FPS and Draw Calls in the location, size and color I need.
When kids learn how to code their own computer games, they reap both primary and secondary benefits — much like when they participate in extracurriculars like art, ballet, or a team sport. Of course, learning how to code is an invaluable skill. Coding Boosts Teamwork and Collaborative Skills Programming is a team project.
For more than 24 years, we’ve taught kids how to code by using video games to frame sessions and make classes exciting. To get into the AI spirit, let’s check out a few ways that programmers can use the power of AI to help tackle coding challenges. There’s a lot of speculation and some of it is really overheated.
It also provides powerful tools for debugging, testing, and coding. Embrace DebuggingDebugging is a significant part of development, and that is why you need to learn to use debugging tools for Android Studio effectively to identify and fix issues in your code. What Coding Pitfalls You Need to Avoid?
Programmers use coding tools to help them debug, test, and create software. Let’s look at a few of the best coding tools for high school students to see how RP4K’s older pupils get a leg up. One keystroke will behave differently depending on the coding language used, like language-specific shortcuts.
STEM subjects have always emphasized soft skills like problem-solving and concrete skills, like learning coding skills in the classroom that they’ll need in later grades and while working. Ontario’s curriculum for students in grades 1-8 aims at improving computational thinking, coding, innovation, and scientific and engineering design.
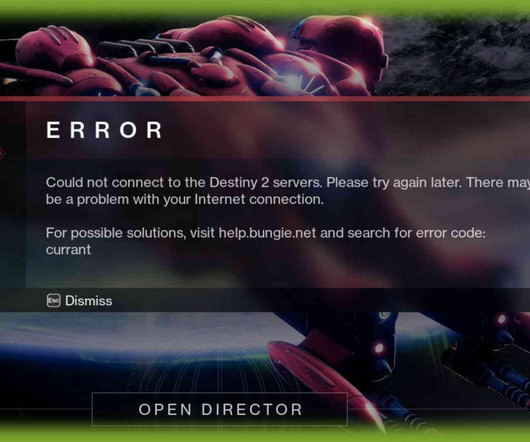
Destiny 2 error code Currant can be annoying since it is difficult to precisely point the finger at the problem causing it. Check how to fix the error code Bee in Destiny 2. Why do I get Destiny 2 error code Currant? How do I fix Destiny 2 error code Currant? This network-related error can be caused by different factors.
Best Practices for Sharing Code Between Cocos Creator Projects Hello fellow developers, I’m currently exploring efficient ways to share reusable code across different projects in Cocos Creator and would appreciate your insights on two methods I’m considering: Git submodules and NPM packages. Has anyone else faced similar challenges?
This week’s Model Monday release features the NVIDIA-optimized code Llama, Kosmos-2, and SeamlessM4T, which you can experience directly from your browser. This week’s Model Monday release features the NVIDIA-optimized code Llama, Kosmos-2, and SeamlessM4T, which you can experience directly from your browser.
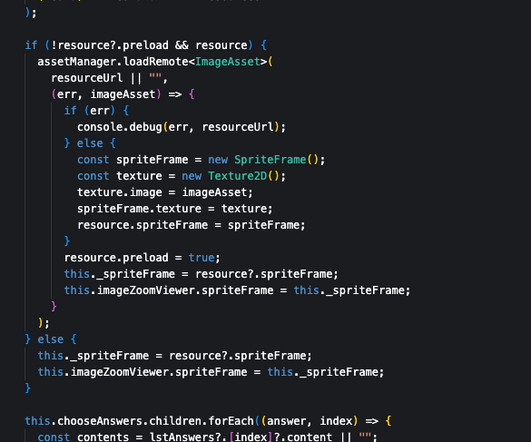
I used assetManager loadRemote to load image resources but it is having some runtime error causing an exception and not running the code attached to ListenerNode below, I can’t debug this problem.
I used assetManager loadRemote to load image resources but it is having some runtime error causing an exception and not running the code attached to ListenerNode below, I can’t debug this problem.
I used assetManager loadRemote to load image resources but it is having some runtime error causing an exception and not running the code attached to ListenerNode below, I can’t debug this problem.
For brand new games, the best we usually do is in-game comments and maybe some auto-documentation because we're writing a lot of new code as we go and time spent documenting is time not spent writing more code. It really depends on the project. For established franchises and lifestyle games (e.g.
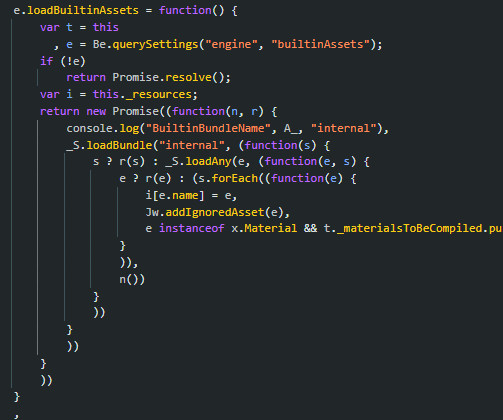
I tried to debug the engine. Found out the value of BuiltinBundleName.INTERNAL is pasted directly to the source code (the result of the engine build process?). So I think there is no way to customize the Internal bundle path except customize the engine.
Today I'm announcing two new extensions for other editors: Visual Studio and Visual Studio Code. The two extensions support debugging of Godot games. They make it easy to launch and debug games from the IDE without the need to tweak any Godot setting. Code completion. This work was kindly sponsored by Microsoft.
We organize all of the trending information in your field so you don't have to. Join 5,000+ users and stay up to date on the latest articles your peers are reading.
You know about us, now we want to get to know you!
Let's personalize your content
Let's get even more personalized
We recognize your account from another site in our network, please click 'Send Email' below to continue with verifying your account and setting a password.


Let's personalize your content