This site uses cookies to improve your experience. To help us insure we adhere to various privacy regulations, please select your country/region of residence. If you do not select a country, we will assume you are from the United States. Select your Cookie Settings or view our Privacy Policy and Terms of Use.
Cookie Settings
Cookies and similar technologies are used on this website for proper function of the website, for tracking performance analytics and for marketing purposes. We and some of our third-party providers may use cookie data for various purposes. Please review the cookie settings below and choose your preference.
Used for the proper function of the website
Used for monitoring website traffic and interactions
Cookie Settings
Cookies and similar technologies are used on this website for proper function of the website, for tracking performance analytics and for marketing purposes. We and some of our third-party providers may use cookie data for various purposes. Please review the cookie settings below and choose your preference.
Strictly Necessary: Used for the proper function of the website
Performance/Analytics: Used for monitoring website traffic and interactions
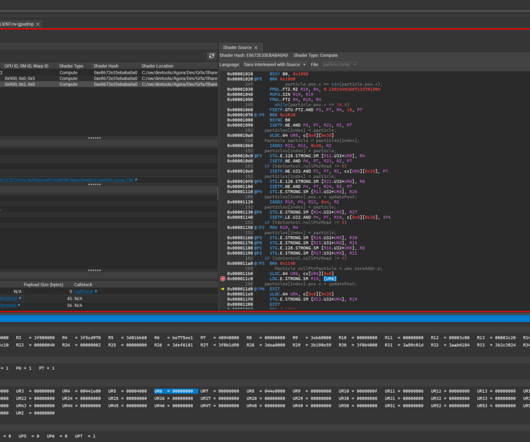
We love shaders, but they can be hard to debug. With shaders, you can add creative expression and realism to the rendered image. They’re essential in ray tracing for simulating realistic lighting, shadows, and reflections. Shader calculations are complex… Source
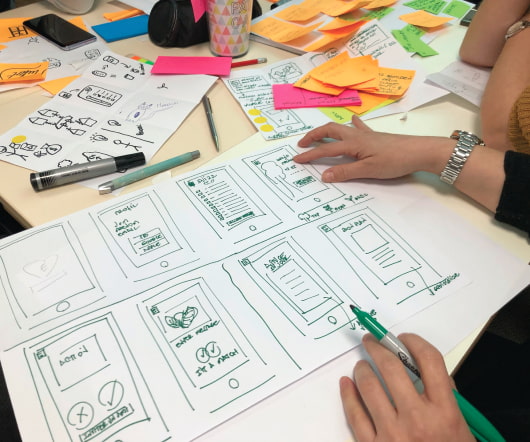
This will be about how when in your C++ code you have a “vector math library”, and how the choices of code style in there affect non-optimized build performance. Backstory A month ago I got into the rabbit hole of trying to “sanitize” the various ways that images can be resized within Blender codebase.
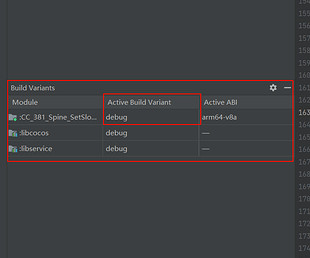
I debugged Android in the following manner. Enable wireless debug option on your Android device Same WiFi connection Enable debug mode and source map options in the build panel I did this, but the information is not displayed. I am currently debugging on a Mac, and the Mac version is 14.4.1
I debugged Android in the following manner. Enable wireless debug option on your Android device Same WiFi connection Enable debug mode and source map options in the build panel I did this, but the information is not displayed. I am currently debugging on a Mac, and the Mac version is 14.4.1
I debugged Android in the following manner. Enable wireless debug option on your Android device Same WiFi connection Enable debug mode and source map options in the build panel I did this, but the information is not displayed. I am currently debugging on a Mac, and the Mac version is 14.4.1
I debugged Android in the following manner. Enable wireless debug option on your Android device Same WiFi connection Enable debug mode and source map options in the build panel I did this, but the information is not displayed. I am currently debugging on a Mac, and the Mac version is 14.4.1
I debugged Android in the following manner. Enable wireless debug option on your Android device Same WiFi connection Enable debug mode and source map options in the build panel I did this, but the information is not displayed. I am currently debugging on a Mac, and the Mac version is 14.4.1
I debugged Android in the following manner. Enable wireless debug option on your Android device Same WiFi connection Enable debug mode and source map options in the build panel I did this, but the information is not displayed. I am currently debugging on a Mac, and the Mac version is 14.4.1
I debugged Android in the following manner. Enable wireless debug option on your Android device Same WiFi connection Enable debug mode and source map options in the build panel I did this, but the information is not displayed. I am currently debugging on a Mac, and the Mac version is 14.4.1
I debugged Android in the following manner. Enable wireless debug option on your Android device Same WiFi connection Enable debug mode and source map options in the build panel I did this, but the information is not displayed. I am currently debugging on a Mac, and the Mac version is 14.4.1
Currently we are using two links: In the case of iOS, the link in the manual did not work and debugging was possible by accessing the second link. The current environment is to debug on the PC screen when playing the game on an Android device. The PC I am using is a Mac mini. Link1 - devtools://devtools/bundled/js_app.html?v8only=true&ws=172.30.1.91:43086/00010002-0003-4004-8005-000600070008
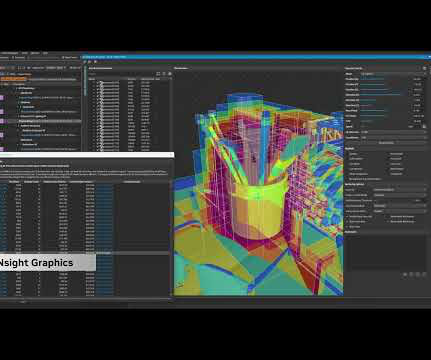
NVIDIA Nsight Developer Tools provide comprehensive access to NVIDIA GPUs and graphics APIs for performance analysis, optimization, and debugging activities. NVIDIA Nsight Developer Tools provide comprehensive access to NVIDIA GPUs and graphics APIs for performance analysis, optimization, and debugging activities.
Richie Shoemaker flicks through the first issue of Debug, a new games magazine edited by veteran mag-ician Dean Mortlock that aims to be a champion for indie titles, studios and publishers
Bonus difficulty if you have to reproduce the bug on a debug build with a low frame rate Silent failure - The bug doesn’t actually trigger any error messages or logs or anything, it just fails silently without a trace Requires multiple players to repro - Happens only on a dedicated server with multiple squads all playing at once!
Today is International Women’s Day, and with the UN’s theme for 2023 being incredibly relevant to games, Amiqus’ Business Manager Liz Prince looks at how studios can celebrate
With World Menopause Day taking place on October 18, 2023, Amiqus Business Manager sat down with Dovetail Games’ VP of People Lindsey Shorricks to talk about the studio’s approach to supporting women’s health
and I need to show 3d physic debug I have a simple capsule which is attached with a cc.BoxCollider In code I have this settings PhysicsSystem.instance.enable = true; PhysicsSystem.instance.debugDrawFlags = EPhysicsDrawFlags.WIRE_FRAME; But when preview with browser I see nothing like a debug line. Hi, I’m using Creator 3.8.2
and I need to show 3d physic debug I have a simple capsule which is attached with a cc.BoxCollider In code I have this settings PhysicsSystem.instance.enable = true; PhysicsSystem.instance.debugDrawFlags = EPhysicsDrawFlags.WIRE_FRAME; But when preview with browser I see nothing like a debug line. Hi, I’m using Creator 3.8.2
and I need to show 3d physic debug I have a simple capsule which is attached with a cc.BoxCollider In code I have this settings PhysicsSystem.instance.enable = true; PhysicsSystem.instance.debugDrawFlags = EPhysicsDrawFlags.WIRE_FRAME; But when preview with browser I see nothing like a debug line. Hi, I’m using Creator 3.8.2
More than once I made DEBUG builds rather than RELEASE builds or forgot to change some debug setting back. I use Microsoft’s Azure to do cloud compiles of the c++ engine for my new game. For Thimbleweed Park builds were hand compiled which took a lot of time and was very error prone.
As ray tracing becomes the predominant rendering technique in modern game engines, a single GPU RayGen shader can now perform most of the light simulation of a. As ray tracing becomes the predominant rendering technique in modern game engines, a single GPU RayGen shader can now perform most of the light simulation of a frame.
There is always some layer of abstraction between the physical computer and the application that you are building, but you can’t optimize and debug what you can’t see. By providing low-level insights to inform debugging, developer tools help eliminate the need to brute-force solutions.
With Pride Month coming to a close, Liz Prince – Business Manager at Amiqus, Founder of the G Into Gaming initiative, and Co-Founder of the Empower Up EDI platform – takes a look at how studios can support their LGBTQ+ employees… When we launched Empower Up with Ukie’s #RaiseTheGame, our goal was to give studios …
Hello all, While using a label with cache mode CHAR and assigning empty string, then calling updateRenderData(true) gives error for failing assert in RenderData.updateRenderData in DEBUG mode in native.(web web works fine) Any help to fix this would be appreciated. This might be a bug in CC3.8.3 since it was working fine in CC3.8.2.
Static analysis is a debugging method, typically used early in development. Find out how it differs from dynamic analysis, benefits and limitations of static analysis — and when you should use it.
Im building for Android and Windows at this stage but Im having issues with the windows build (Android works no problem) When i kick the windows build I get no error and the build gets outputted properly, but when i try to run the exe file (both debug and release version) I get this kind of error: Exception thrown at 0x00007FFCCCD33020 (msvcp140.dll)
More than once I made DEBUG builds rather than RELEASE builds or forgot to change some debug setting back. I use Microsoft's Azure to do cloud compiles of the c++ engine for my new game. For Thimbleweed Park builds were hand compiled which took a lot of time and was very error prone.
Unity Muse Chat lets you create real-time 3D experiences within the Editor by assisting with debugging and providing context-aware solutions to issues. Dive into the details of how the LLM pipeline delivers greater relevance and reliability.
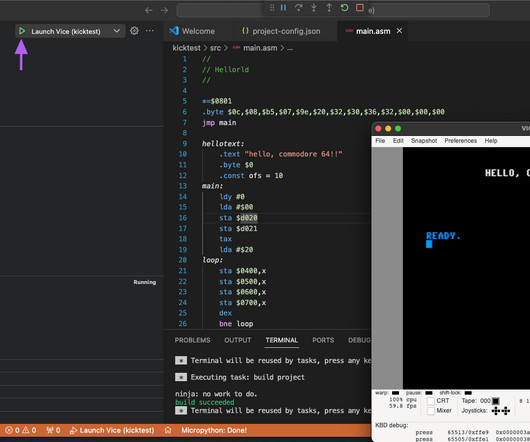
vs64 extension welcome page in visual studio code Setting up VS64 The vs64 setup wizard There are three parts to using VS64: Installing the required tools (if you are going to be compiling and debugging). This is all the same information available on the Github page linked earlier. The recommended file extension is .asm
It has beefier hardware than the retail console (because it needs to be able to hold and run debug builds of the game). Game consoles today typically have plugins for Microsoft Visual studio to handle the remote debugging process. Those text interfaces exist so we can access debug commands.
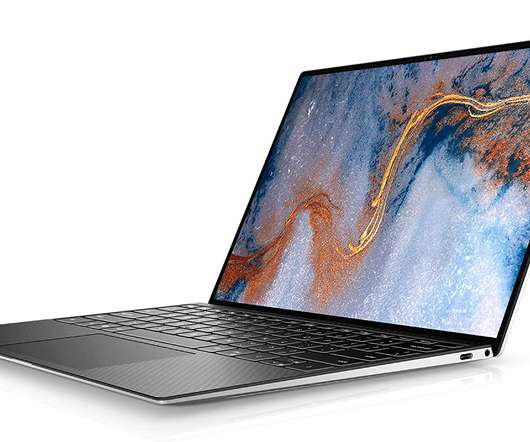
Visual Studio Code - IDE Visual Studio Code (VS Code) is a lightweight, free, open-source code editor redefined and optimized for building and debugging modern web and cloud applications. It is highly extensible, and is available for Windows, MacOS, and Linux, providing a common ground for developers working on multiple platforms.
Amiqus’ business manager Liz Prince talks to Perri Lewis, CEO of Mastered, about the organisation’s training and mentoring programmes which are helping get grads ‘job ready’, coaching ‘accidental managers’, and supporting those from under-represented groups
With the MCV Women in Games Awards having taken place earlier this month, Amiqus Business Manager takes a look at why women-only celebrations are still super important
I’m trying to test some performance issues on a game that’s crashing and I’m currently investigating the possibility of it being too much memory being used for texture cache… When I use fps on game preview, I’m able to see GFX Texture Mem… but I’m wondering, can someone please tell me what the unit of measurement is for this number?
I’m trying to test some performance issues on a game that’s crashing and I’m currently investigating the possibility of it being too much memory being used for texture cache… When I use fps on game preview, I’m able to see GFX Texture Mem… but I’m wondering, can someone please tell me what the unit of measurement is for this number?
I’m trying to test some performance issues on a game that’s crashing and I’m currently investigating the possibility of it being too much memory being used for texture cache… When I use fps on game preview, I’m able to see GFX Texture Mem… but I’m wondering, can someone please tell me what the unit of measurement is for this number?
With April representing World Autism Month, Amiqus’ Liz Prince spoke with Giorgia Molinari, the new head of corporate and games partnerships at Autistica
Amiqus’ Business Manager Liz Prince speaks to Dom Shaw, EDI coordinator at Ukie who also leads #RaiseTheGame, about the recent Access November initiative.
In this article, Amiqus’ Liz Prince speaks to Limit Break’s Director Lana Zgombić and Programme Co-Ordinator Lauren Kaye about the organisation and its goals
It's mostly that I've gotten very used to the visual debugging found in Xcode and Visual Studio. The real issue is going to be developing the "engine", which I spend most of my day doing. Writing C/C++ code in a nice text editor and compiling it isn't really the issue. It seems that Linux IDEs are really behind in this.
As the school holidays end, and with some children starting nursery and primary classes for the first time, Amiqus’ Business Manager Liz Prince looks at the challenges facing parents looking to return to work – and offers some thoughts on what studios can do to encourage and support them
As we head into a new year, Amiqus’ business manager highlights some key advice and commentary from contributors to this column over the past 12 months, to help studios formulate and plan their EDI strategies for 2023 and beyond
You can now deploy your projects to all desktop platforms over SSH, as well as run a remote debug session similar to what we already offered for Android and Web. As the number of remote debug options is quite big by now, we’ve packed them neatly in a single drop-down menu ( GH-63312 , GH-70701 ). Jump to the Downloads section.
We organize all of the trending information in your field so you don't have to. Join 5,000+ users and stay up to date on the latest articles your peers are reading.
You know about us, now we want to get to know you!
Let's personalize your content
Let's get even more personalized
We recognize your account from another site in our network, please click 'Send Email' below to continue with verifying your account and setting a password.


Let's personalize your content